Human vs. AI Perceptual Alignment
An investigation into whether Vision-Language Models categorize scientific visualizations in ways that align with expert judgment. The study evaluates 13 models on a labeled image set and measures agreement on visual purpose and encoding patterns.


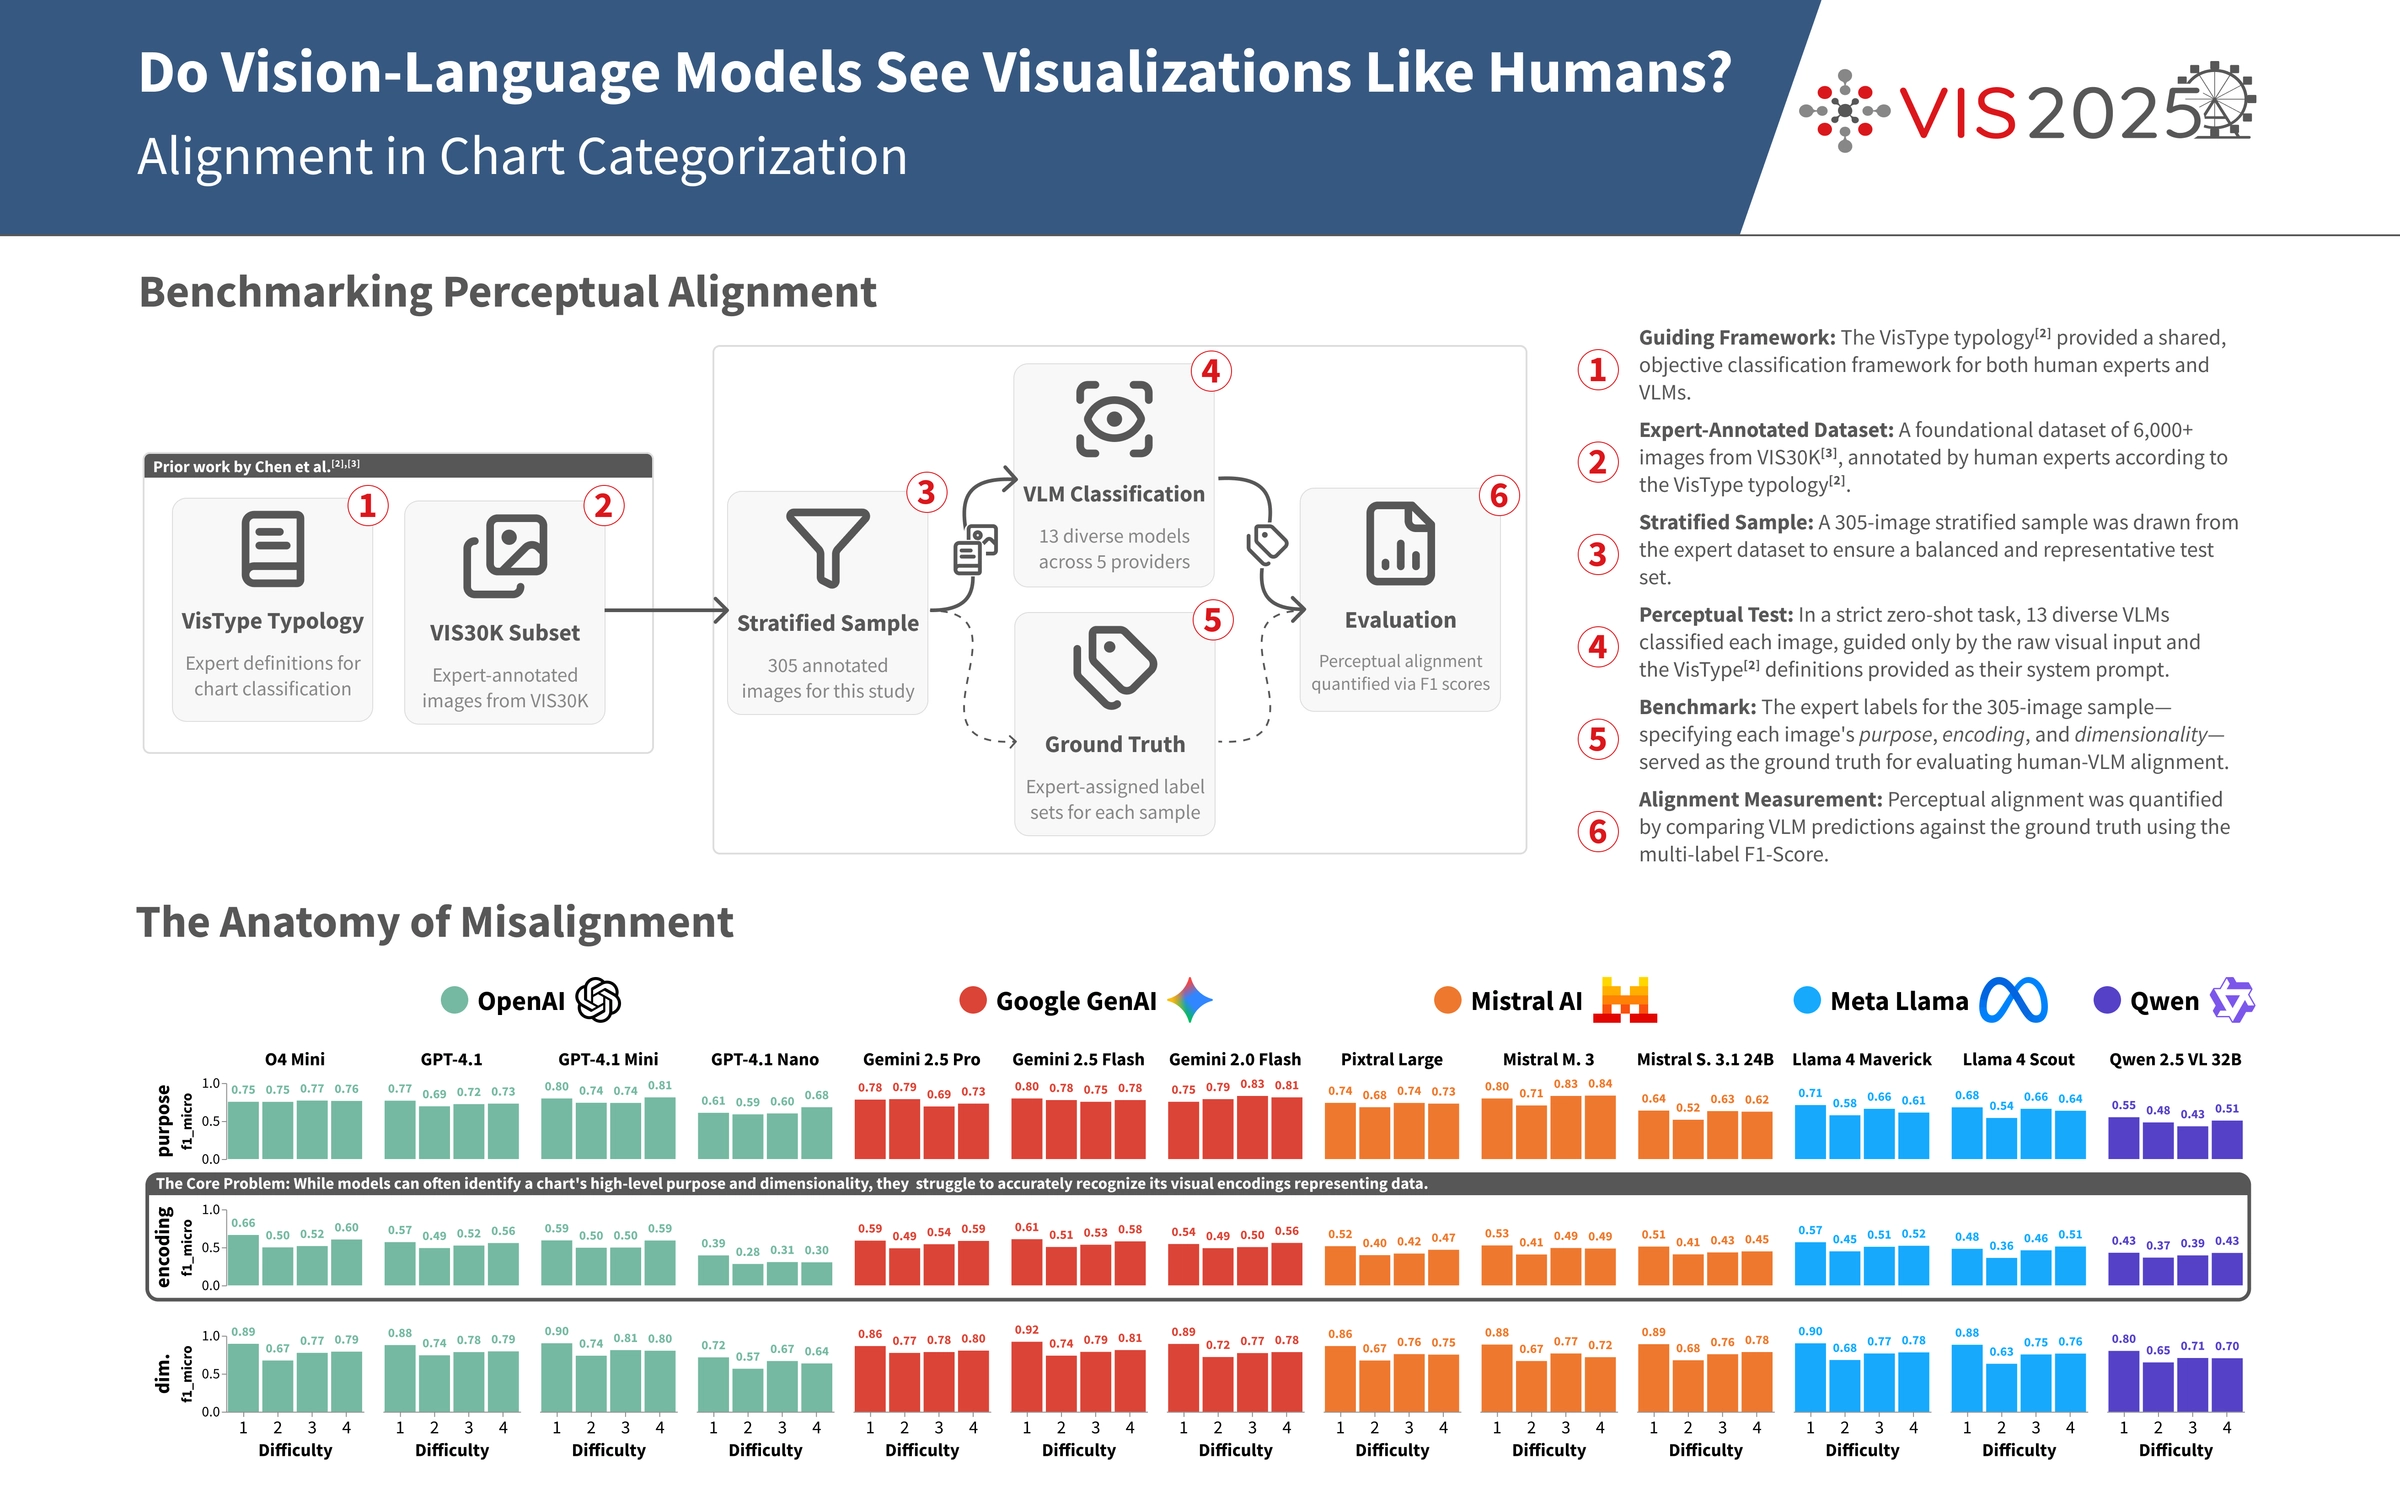
The increasing use of AI to interpret visual data rests on a key assumption: that models “see” charts and figures in ways that match human expertise. This study tests that assumption by comparing Vision-Language Model outputs with expert annotations.
To explore this, we designed a systematic evaluation, comparing the classifications of 13 models against a ground truth of expert annotations on a labeled set of scientific visualizations. The focus was on pure visual categorization—assessing a model’s ability to identify a visualization’s purpose, encoding, and dimensionality without any textual context. The engineering behind the study was designed for rigor and reproducibility, using a multi-provider setup with tools like
The goal is not to crown a “best” model, but to provide a measured, quantitative view of the alignment gap. The results show where current models agree with human consensus and where they reliably diverge, including specific failure modes on complex encodings. This research, accepted at IEEE VIS 2025, contributes evidence about current capabilities and limitations in visual data analysis.
Stack
While the problem is more important than the tools, the tech stack tells a story about the project's architecture and trade-offs. Here's what this project is built on:
Platforms & Runtimes

Frontend & Visualization


AI & Machine Learning

Orchestrates multi-provider model integration and structured outputs for categorization tasks.

Provides models used for zero-shot visualization categorization evaluation.

Provides models used for zero-shot visualization categorization evaluation.

Provides models used for zero-shot visualization categorization evaluation.

Provides models used for zero-shot visualization categorization evaluation.

Provides models used for zero-shot visualization categorization evaluation.

Routes requests to multiple providers behind a unified API for model comparison.

Computes multi-label classification metrics and confusion matrices.


