Aug 2025 · Creator
Agentic Visual Reporting
Agentic Visual Reporting composes language models with statistical tools and explicit chart-design rules. A fixed pipeline turns their outputs into an interactive report with executable provenance.
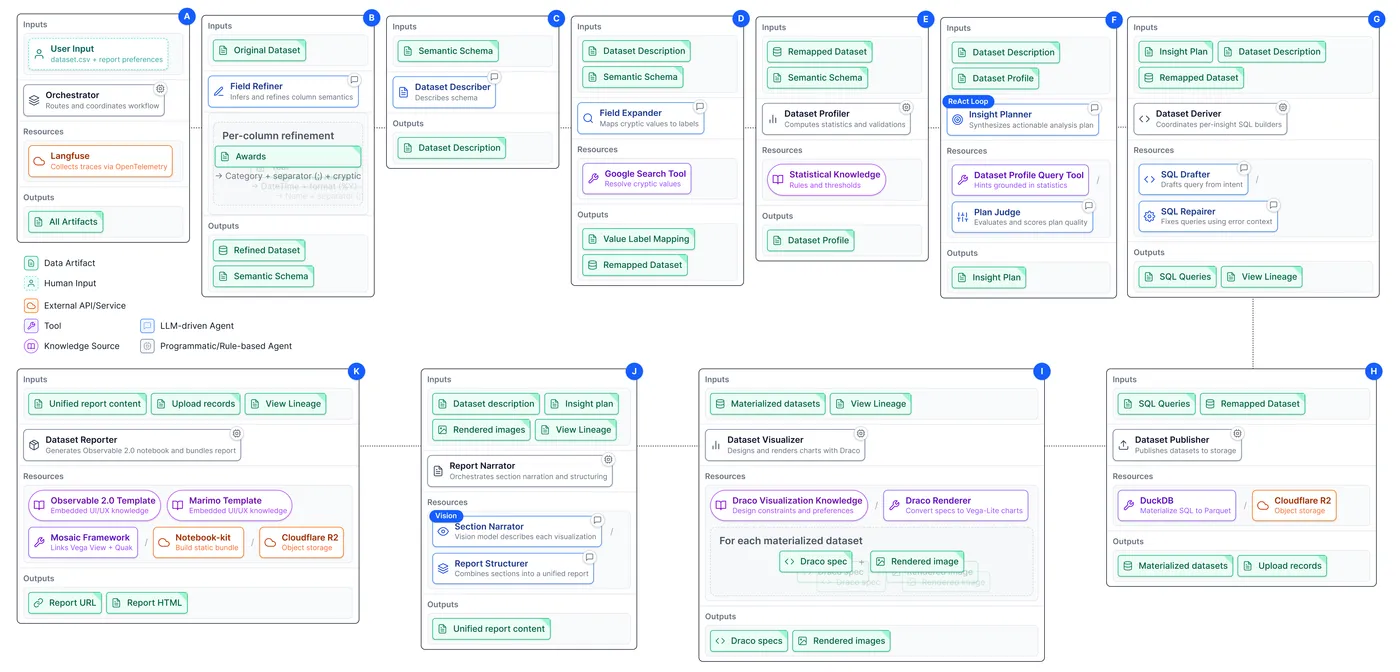
We kept orchestration deterministic and used model reasoning for bounded tasks: interpreting fields, proposing questions, writing queries, and narrating findings. The pipeline determines what each stage receives. The planner works with computed statistical hints, while Draco, a rule-based visualization system, chooses chart designs from explicit constraints.
That separation makes mistakes easier to locate. When a report split a scatterplot by a nearly constant field, the trace led back to a hint offered to the planner. Adding a diversity threshold to the hint-generating tool changed which fields it would recommend in future runs.
Queries, derived data, chart specifications, and explanations remain separate artifacts. The same artifacts feed an Observable report for exploration and a marimo notebook for tracing an individual finding. An analyst can change one part and keep the rest.